TS9001 TDR System
The system accurately analyzes the wiring quality of various leading-edge semiconductor packages such as Flip Chip BGA, wafer level packages, and 2.5D/3D ICs using terahertz technology. It is a TDR analysis system that has the world’s top-class signal quality.
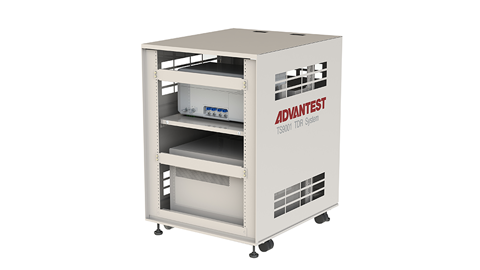
TS9001 TDR system
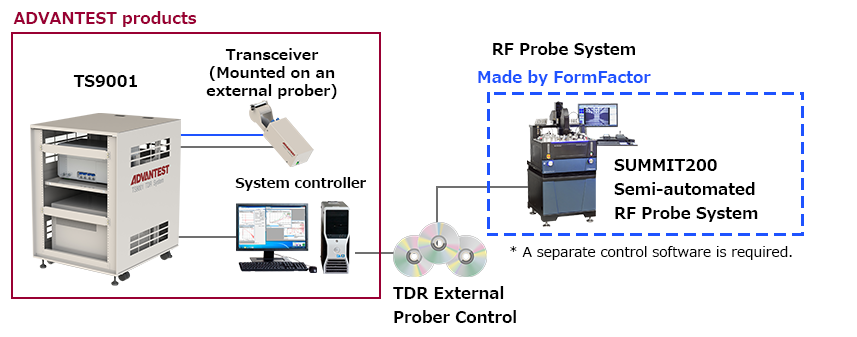
Can be connected to various kinds of probers!
It can be connected to a radio-frequency probing system that you own or have selected, providing flexible solutions that match your device shape and fault analysis environment.
Feature
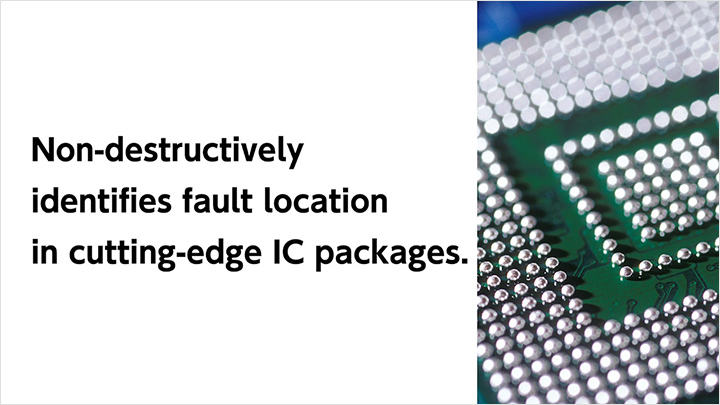
As semiconductor packages grow smaller and become more highly integrated, there is a growing need to locate faults non-destructively and with a high degree of precision. Therefore, it is necessary to have a system that can easily create the optimal analysis environment according to diverse fault analysis conditions.
The TDR analysis of the TS9001 TDR system conducts rapid, high-precision, and non-destructive analysis of faulty areas of the wires in cutting-edge semiconductor packages, electronic components, and printed boards by performing high-resolution TDR measurement (time domain reflectometry) utilizing our proprietary short pulse signal processing technology.
Capable of conducting a fault analysis for 2.5D_IC and 3D_IC
Resolution for faulty area detection: < 5μm
Automated TDR measurement
By using the auto touch-down function of the auto prober, the system conducts precise and reproducible measurements, contributing to the reduction of human errors.
DUT temperature control available (TS9001 + external prober connection)
(Example)SUMMIT200 by FFI (high/low temperature model: -60 ℃ to 300 ℃)
A variety of analysis software available
Failure Position Viewer, which indicates the faulty areas on the CAD data, is provided. (Optional)
TDR Measurement Utilizing THz Technology
Problem in fault analysis using the oscilloscope TDR ⇒ Large error gap in locating fault points
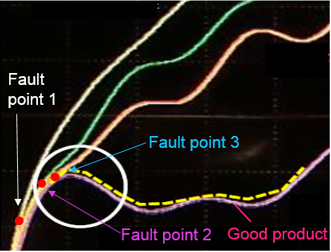
Step response waveforms are used for the probe signals used for the analysis.
The starting points of the amplitude change of the TDR waveforms obtained from good and faulty
products are identified as fault points. However, the starting points are unclear, so there is a large error gap in locating the fault points.

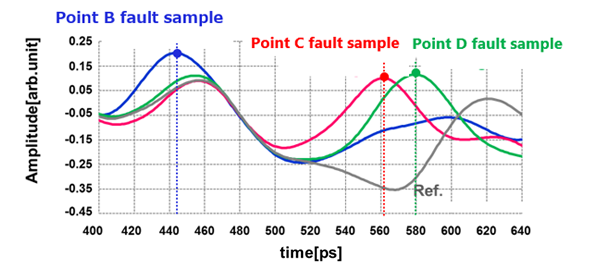
By using impulse waveforms for probe signals, fault points are identified easily at pulse peaks (intuitively).
Observes fault points as peaks
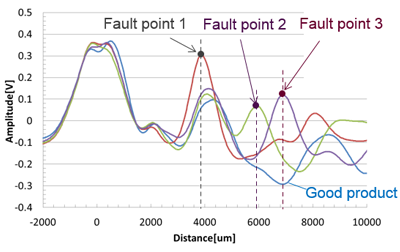
The starting points of the amplitude change are unclear.
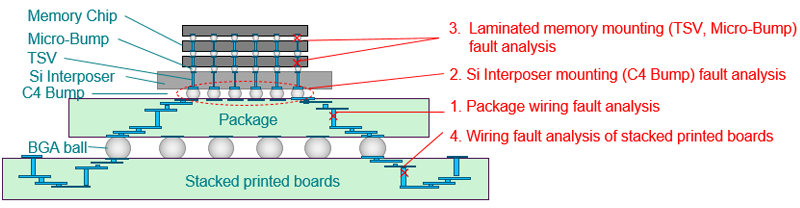
Fault analysis of highly integrated LSI packages
1. Fault analysis of the wiring in packages
Determines whether a wiring fault point is in the Si Interposer or the package
Identifies whether the fault was caused by a factor in the pre-process or post-process
2. Si Interposer mounting (C4 Bump) fault analysis
Identifies and analyzes the conditions for mounting the Si Interposer by using a test vehicle
Performs fault point analysis of the daisy chain structure on the test vehicle and
gives feedback to the mounting conditions.
3. Laminated memory mounting (TSV, Micro-Bump) fault analysis
Identifies faulty layers of a laminated chip
4. Wiring fault analysis of printed boards
Identifies fault points of the vias and signal lines in stacked boards
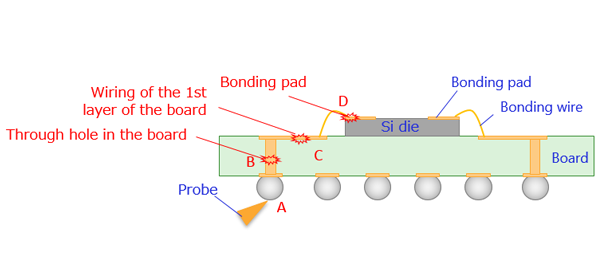
Fault analysis of Small-BGA
-
Performs a TDR analysis by forming open faults in the through hole, wiring, and bonding wire in a board
-
Detects the reflected pulse from a fault point even in packages with a complicated structure
Main Analysis Cases
-
For fault analyses in TSV and other minute vias or between bumps
-
For temperature dependency analyses of faults in contact points
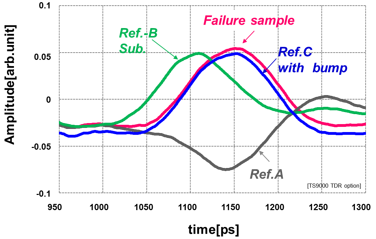
-
For analyses of high-resistance faults, which appear as minute differences between waveforms
Main Functions/Specifications
-
The maximum measurement distance when the effective dielectric constant of the transmission line to be measured is 5.
-
Number of integration: 1024, Probe contact time not included
-
The minimum pad that can be monitored by the camera. The minimum pad that the system can contact depends on the probe used.
The minimum contact pad of ACP110 (RC option) by FormFactor, which we recommend, is 40 μm × 70 μm. -
@ Time domain: 0 to 800 ps, accumulated 16384 times
-
@ Time domain: 800 to 1500 ps, accumulated 16384 times
-
These are the specifications when Prober SUMMIT200 by FormFactor is used.
-
It may be restricted by the operating temperature range of the probe used. The operating temperature range of ACP110 by FormFactor, which we recommend, is from -65 to +200 ℃.
-
Optional. Product code: PYTE01-21MAIS
-
A function when CAD Data Link option (PYTE01-21MAIS) is used
The TS9001 TDR system is equipped with TDR Analyzer as a standard feature. It also has an integration function and supports step waveform analysis (oscilloscope observation).
In
addition, by using the TDR CAD Data Link option, faulty areas on the CAD wiring data can be mapped, which makes it easier to deduce the cause for the faults.
Basic functions and usage examples of TDR Analyzer
Basic functions
-
1.Waveform calculation function
Scaling & offset, smoothing, four arithmetic operations, differential, integral, and normalization -
2.Marker function
-
Indication of the amplitude, time, and distance of a marker position
Effective dielectric constant specified:
Calculate the distance from the time
Distance specified:
Calculate the effective dielectric constant from the time -
Peak detection
Detection by specifying a peak threshold and detection through the rising/falling edge Marking of multiple reflected points
-
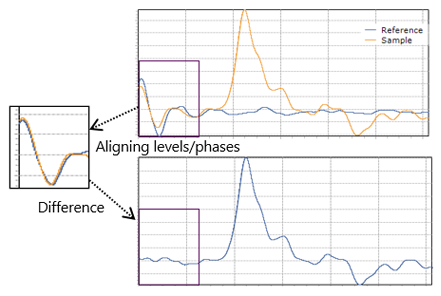
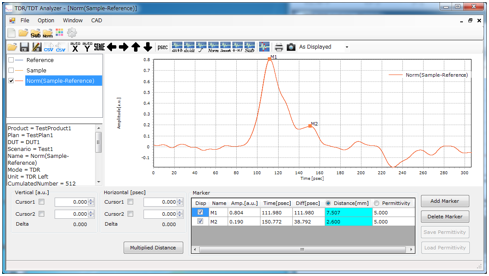
Usage example 1. Normalization calculation
By aligning the waveform levels and phases of the reference (good product) and sample (faulty product) and obtaining the difference, it is possible to extract only the characteristics of the sample waveform.
The waveform characteristics that are common between good and faulty products are canceled, which emphasizes only the characteristics of the faulty product.
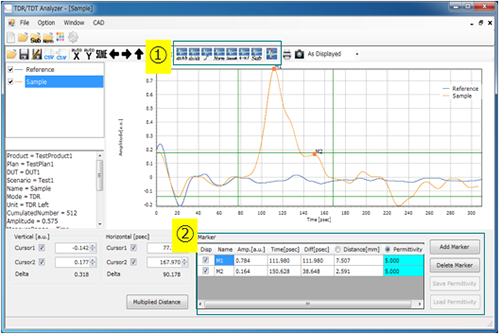
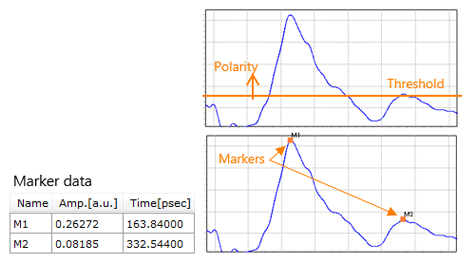
Usage example 2. Peak detection function
Finds peaks that meet the conditions from the waveform and displays markers on the waveform. Detecting the peaks makes it easy to locate faults.
Detection is performed by
specifying the polarity and threshold value of the peak to be detected. The detected peaks are indicated with markers. The marker positions are displayed in a list.
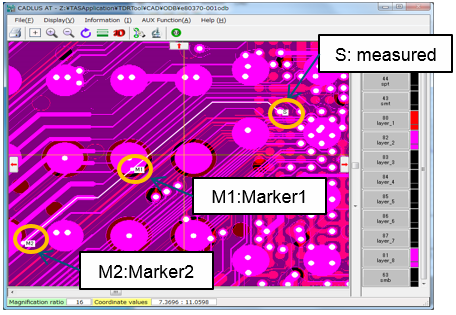
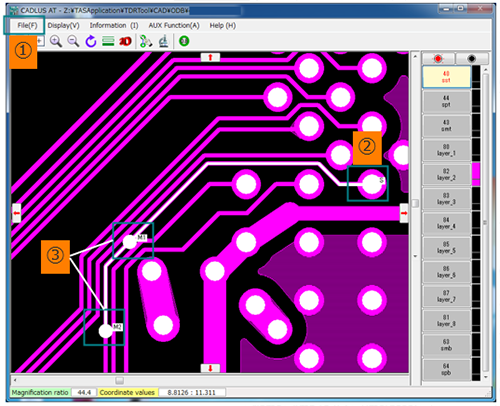
Basic functions and usage examples of Failure Position Viewer
-
1.Loading CAD file
ODB++ (advocated by Mentor Graphics Corp. and supported by many industry-leading CAD/CAM vendors) -
2.Specifying TDR measurement positions
It is possible to click the PAD position to be measured with a mouse to specify a measurement point. -
3.Visualizing predicted fault positions
Supports wiring across multiple layers and branched wires.
Basic functions
Detects peaks that indicate the characteristics of faulty positions by using the waveform calculation and marker functions of TDR Analyzer.
Usage example 3. Visualizing predicted fault positions
When Failure Position Viewer starts, marker positions are displayed in the Viewer, which allows you to predict faulty positions on the CAD data.