We believe that it is essential for a diverse workforce to be able to play an active role in order for a company to grow sustainably. We respect the diversity of our employees, support flexible working styles, and treat them fairly, striving to create an environment where employees can work in their own way and find fulfillment. Additionally, we are working to protect and respect the human rights of all people involved in our business.
Efforts to Promote Diversity
Active participation of each employee is crucial for a company's sustainable growth. Thus, Advantest has "INCLUSION AND DIVERSITY" as one of its core values. We believe that creating a comfortable and inclusive workplace environment and instilling working practices that maximizes employee capabilities while balancing work and home is imperative to a company. Based on this idea, we are actively working to create a workplace and corporate culture where each and every employee at Advantest can maximize their individuality and abilities and continue to play active roles in the company.
Employment and Utilization of Global Human Resources
Advantest has consistently strived for success and growth by attempting to leverage our talented human capital on a global basis. One of the most notable examples of this is the integration of Verigy, acquired in 2011. This integration resulted in a major change in our workforce composition, with nearly half of our employees located overseas at that time. Today, this trend is even stronger, with approximately 60% of our workforce now located in our overseas bases. In the recent years, in order to further expand its business globally, Advantest has been recruiting personnel who have deep cross-cultural understanding and communication skills and can work in a global arena.
For instance, Advantest will continue personnel exchange among group companies so that employees can experience working in a global environment, and share their skills and know-how through routine work and training in each organization so that individual employees can acquire more advanced skills, including skills to adapt to various business environments.
Advantest Group operates a “Global Transfer Policy" for inter-company transfers. In order to facilitate the exchange of talent among Advantest Group companies, the Global Expatriate Program was comprehensively revised in fiscal 2024, and is now in place to ensure fair treatment of employees regardless of their types of operations on a global basis.
In addition, as competition for human resources intensifies on a global scale, we are striving to retain excellent human resources by expanding the scope of stock compensation and grant.
As of July 2025, 16 out of 28 executive officers, who are management personnel, have foreign nationalities, and employees from 11 countries are currently working for Advantest Corporation. Advantest will give fair opportunities to talented personnel, regardless of their nationality, and promote global personnel development and organizational globalization through borderless personnel recruitment and exchange.
Support for Divers Workstyles through Internal and External Second Job Systems/Double Career Programs
Advantest acknowledges diverse workstyles for the sake of our employees' diverse lifestyles and individual growth. As part of this effort, in November 2022, we established rules for external double careers (second jobs) for all employees with the aim of improving employee skills and acquiring and retaining a wide variety of talents. As of July 2025, 28 employees are engaged in second jobs.
Advantest has a diverse group of employees with special skills. We believe that second jobs not only provide employees with opportunities to improve and develop their skills, but also help to create innovation within the company by giving the company a grip on these talented skills.
On the other hand, second jobs naturally come with risks. For this reason, along with requiring employees to obtain approval to engage in second jobs, the company also requires that both the employee and his/her supervisor read the manual thoroughly and take an e-learning course to guarantee that they fully understand the precautions before starting a second job.
While due consideration is to be paid to the risks involved, second jobs are attractive not only to employees but also to the company itself as a way to develop and improve employees' skills and produce innovation within the company. We will endeavor to make the system meaningful while developing rules in response to the changes over time.
Internal Double Career Program
In April 2025, Advantest launched the internal double career program to encourage employees’ self-directed and autonomous career development in a similar manner. Under this system, employees can apply for and be matched with jobs offered by recruiting departments within the company, allowing them to engage in work outside their current departments, with a maximum of 20% of their weekly working hours. The program is designed to provide opportunities for motivated employees to further develop their skills, and to promote organizational and individual growth by expanding opportunities for utilization of human capital, which would ultimately increase corporate value.
Promotion of Women's Participation in the Workplace
Advantest always accepts diverse values and is promoting the creation of a corporate culture where everyone can work regardless of race, gender, age, and nationality. As of March 2025, the percentage of female employees to total employees is 22.0% (21.8% in the previous fiscal year), and the percentage of female managers to total managers is 9.7% (9.4% in the previous fiscal year). Increasing the number of female employees and managers still remains an urgent task.
Advantest has been recruiting students with a technical background, which has not motivated female students to take entrance exams for Advantest in recruitment activities. In light of these circumstances, Advantest has been strengthening public relations activities for women with a focus on conveying the attraction of Advantest to female students, particularly those with a technical background. Information on active female employees in the workforce has been disseminated through corporate websites and recruitment brochures, and at recruitment events, Advantest has explained about programs and career plans for women and introduced how our female employees are working at Advantest.
Advantest Corporation (non-consolidated) has set numerical targets to boost the ratio of women in management positions to meet or exceed the industry average founded on the General Employer Action Plan based on the Act on Promotion of Women's Participation and Advancement in the Workplace, and has been making efforts toward this goal. In 2020, we acquired "Certification level 2 (two stars)" of the 'Eruboshi' certification based on the Act on Promotion of Women's Participation and Advancement in the Workplace. We give consideration to the various changes in female employees' life stages, with a focus on providing support to enable good work-life balance through flexible working styles that correspond to each individual's circumstances. By promoting an environment where employees can continue to work for many years, we are supporting opportunities for all employees, including women, to play active roles.
In addition, in FY2024, a group of employees launched an internal community called “Co-sodate” with a focus on child-rearing. This community serves as a place for employees who are raising children to exchange information, helping them balance work and child-rearing.
Advantest will move forward with initiatives to raise the female employee ratio and establish systems for long-term employment toward increasing the ratio of female employees in management positions.

Initiatives to Improve Communication Among Mid-Career Employees (Japan)
Although the majority of Advantest's employees are new graduates, the number of mid-career employees has been increasing over the past few years. To promote understanding of Advantest's corporate purpose & mission and our product portfolio among mid-career employees and to help them get to know members of other departments, the following initiatives are being implemented starting from 2023.
-
Mid-Career Hire Follow-up Day
-
Mystery Lunch
-
R&D Department Tours
-
Greeters
These initiatives were developed from the voices of our fellow employees. In response to these requests, a group of volunteers communicated with each other, formulating an even larger project, which promoted interaction with those who joined mid-career and led to new projects. An environment in which mid-career employees can play active roles leads to an environment in which all employees can play active roles. We will continue to value diversity and revitalize our organization.
Please note that there is a GNEO program implemented globally for mid-career employees. For more information, see "Global New Employee Orientation (GNEO)".
Mid-Career Hire Follow-up Day
A follow-up training program was launched for employees who joined the company in the last two years and 98 employees participated in the program.
So far, training for mid-career hires has consisted mainly of introductory training by the Human Capital Department on the hire date, which included an explanation of regulations, etc., and business training in which other employees also participated. The Human Capital Department devised opportunities to see if there are any other good training programs or to increase horizontal connections, while mid-career hires wished to learn more about the company's products and history, as well as to visit other business sites. The training, therefore, was achieved as a perfect result by the two parties.
This training is a one-day program that allows mid-career employees to deepen communication with each other.
Supervisors and general managers also attended the reception, providing a casual and relaxed atmosphere. In a questionnaire after the training, many participants remarked that, "It was good to be able to communicate with people we don't normally have much contact with".
Advantest will move forward with initiatives to raise the female employee ratio and establish systems for long-term employment toward increasing the ratio of female employees in management positions.
Mystery Lunch
To improve employee communication, which remains a challenge, lunch gatherings were organized. We have named this lunch gathering as "Mystery Lunch", since several participants are chosen at random from those who wish to attend, to eat lunch together. During the planning process, many employees took the initiative to join the secretariat. The lunch gatherings have been held at almost every business location Japan, with a total of more than 500 people attending. Since this was an unprecedented initiative, the lunch gatherings provided a valuable opportunity to resolve simple questions about the company or gain those to turn to in times of trouble.
Some of the mystery lunch participants went on to have get-togethers afterwards, and some made friends within the company. For reference, Q12® on Gallup's Engagement Survey asks the question, "Do you have a best friend at work?" We believe that the mystery lunch was an outstanding initiative, for having friends within the company enhances employee engagement.
For more information on Gallup's engagement survey, see "Employee Engagement".
Tour of the R&D Department
This initiative was suggested by a manager in the administrative department who propsed, "Many people in the administrative department do not know much about our products, so we want to give them a chance where they can learn. Seeing and learning about the products should lead to better engagement!"
After receiving lectures on memory, T2000, and V93000 products from the employees in charge, the participants were given a tour of the actual equipment. The program was then rolled out to new hires, mid-career employees, and indirect department employees as well as the Corporate Administration Group. The program received a stream of positive feedback from the participants, and we plan to continue hosting these tours in the future.
Greeters
In April 2024, a community called "Greeters" was launched at the initiative of 12 volunteers at four domestic locations to support an environment in which employees who have joined the company mid-career can play active roles.
Greeters provides a place where newly joined employees can feel free to ask questions and seek advice, mainly from employees who have similar experiences, so that they do not run into any obstacles. In the Greeters group chat room, which has about 90 registered members from various locations in Japan, information useful for both inside and outside the company, such as self-development seminars held by volunteers and introductions to technical events and social gatherings, is exchanged, providing opportunities for mid-career employees to unlock new discoveries and tips for growth.
In June 2025, Greeters received "The INTEGRITY Award" (an internal award where employees nominate, recognize, and celebrate peers who embody INTEGRITY), further highlighting Greeters' activities.
Going forward, Greeters will continue to contribute to the growth and development of the company as a whole by supporting employees and promoting communication to build a better work environment.
Active Utilization of Senior Employees (Japan)
Following the amendments to the Act on Stabilization of Employment of Elderly Persons in April 2013 and the increase in the minimum age for pension eligibility by the government, Advantest has revised its re-employment program for utilizing employees who retire at the age of 60. Advantest is actively utilizing the skills and know-how of experienced employees by employing senior personnel steadily and treating and assigning them to jobs with consideration towards their past experience and assigned positions during their working years. In addition, Advantest has established a system to reflect each individual's achievements in their wages to motivate senior personnel and expect them to produce results that match their wages. Furthermore, in FY2018, Advantest introduced a system where employees are allowed to reduce their working hours or days as desired and have a second job on non-working days.
In FY2024, of the 73 individuals who started with our re-employment program, seven employees are working shorter days. This system will allow senior personnel to work more flexibly according to their lifestyles, contributing to further enhancing work-life balance.
Example
At Advantest, a senior employee with many years of experience in the Production Unit has begun holding a training course for employees at the Gunma Factory titled "What is a Tester?" since June 2022. When asked of his motives for developing this course, he mentioned that products are increasingly difficult to understand as they have evolved in complexity, and the psychological burden on employees has been swelling due to the spread of COVID-19 pandemic as well as by the challenges faced in parts procurement with production volume increasing rapidly. The senior employee planned the event hoping that by learning about testers, it would teach people the relationship between their own work and products, as well as between products and society as a whole, and ultimately, everyone could find their work rewarding.
Since May 2023, in response to requests and feedback from employees who shared the enthusiasm for this initiative, which was published on the internal newsletter, a series of lectures titled "What is a Tester?" were launched in domestic and overseas' bases. The lectures were created from the perspective of senior employees with diverse career backgrounds. In FY2024, the Human Capital Department has been developing small-group, face-to-face training courses for administrative employees. By listening to firsthand accounts of how the lecturers have faced the history of semiconductor evolution, participants have been able to learn the importance of adapting to change.
Trends in the number of employees who use the re-employment program

-
*Boundary of data: Advantest Corporation
(including employees seconded to subsidiaries, excluding employees received on secondment from subsidiaries),
subsidiaries in Japan.
Advantest is tallying the number of employees who have started using the re-employment program.
(These numbers do not include those who have been using the program since the previous year.)
Employment of the Disabled
In order to promote the employment of the disabled, Advantest established a special subsidiary company, Advantest Green Corporation, in September 2004. Since its establishment, this company has been working to promote stable employment of the disabled under the slogan of "Independence of individuals and growth of society."
Its core business includes landscaping, cleaning, front gate reception work, delivery, baking and sale of bread, and recycling promotion. Advantest Green is providing workplaces where its employees can work comfortably, and is also actively collaborating with local communities and relevant organizations to develop workplaces where disabled and non-disabled people can work together.
Currently, 31 highly motivated disabled employees are working at overseas affiliated companies.
As of March 2025, Advantest's employment rate of the disabled is 2.86%, which exceeds the mandatory employment rate. However, Advantest will continue to actively promote the employment of the disabled to address future amendments to the mandatory employment rate.
Efforts to Explore New Occupational Fields
Advantest promotes initiatives such as standardization of work procedures and work visualization to create a work environment in which employees with disabilities will be able to work to their full potential, and also refer our workplace as one in which people with various disabilities can actively participate to outlets such as special-needs schools. We also actively accept training and visitation requests for employment as well as consider new job categories and more.
Advantest introduced a paper-making machine, which produces new paper from used paper such as rejected documents, in order to launch a business that manufactures and provides items such as copy paper, business cards, and calendars made from recycled paper. We continue to support initiatives that promote employment and contribute to environmental improvement.
For more information on recycling using paper machines, please refer to "Recycling Resources"on the Environment page.
Efforts to Enhance Job Fulfillment
We also foster a culture of mutual respect and recognition by actively implementing initiatives through a goal or commendation system to enhance their motivation, such as "meaningfulness" and "job fulfillment," and established a "Monthly MVP" award system that involves evaluation and praise by others.
Additionally, Advantest assigns qualified staff including job coaches, counselors for the disabled, and career consultants at each workplace, along with conducting regular four-way meetings with support organizations, the company, and family members for early detection and information sharing on issues, in order to offer workplace support catered to the characteristics of employee disabilities.
In FY2021, these initiatives and the many efforts made by our employees over the years were recognized by Saitama Prefecture, and two Advantest Green employees received the President's Award from the Saitama Prefecture Employment Development Association as excellent workers with disabilities.
Trends in the percentage of disabled employees

-
*Boundary of data: Advantest Corporation
(including employees seconded to subsidiaries, excluding employees received on secondment from subsidiaries),
Advanfacilities Co., Ltd., Advantest Green Corporation
Respect for Human Rights
The Advantest Group recognizes that respect for the human rights of all those affected by our global business activities is essential. We support and participate in the ten principles of the United Nations Global Compact, which take into account the fundamental responsibilities of business in the areas of human rights, labor, environment, and anti-corruption, as advocated by the United Nations Global Compact, and we have also joined the Global Compact Network Japan, a local network in Japan that support the same principles of the United Nations Global Compact. We are continuing to promote initiatives in each of these areas.
This respect for human rights is stipulated in "The Advantest Way" and forms the basis of all our activities.
Fair Evaluation and Treatment
Performance assessments and career development are conducted under a common global system. Goals are set at the beginning of the fiscal year, communication with superiors is conducted as necessary during the year, and an evaluation interview is conducted at the end of the fiscal year. This interview is conducted not only for full-time employees but also for some contract and temporary employees.
In terms of compensation, we are not only committed to fairness, but also to the retention of the best talent who will ensure our future growth.
Advantest Resource Management System (ARMS)
With overseas sales ratio of over 90%, and more than 60% of our employees located in overseas affiliated companies, this allows Advantest to grow as a global company. Given this structure, we introduced the Advantest Resource Management System (ARMS), a unified human resources system, in April 2012. ARMS promotes cooperation among multiple bases around the world, as well as smooth personnel exchanges and transfers.
Global human resource system
Under ARMS, the unique job classification systems decided on by Group companies in each country have been replaced by a new 10-level job system that is common to all. In this system, job levels 1 to 6 are for general employees, while levels 7 to 10 are for management positions. There are two management paths in this system: one for "people managers," who manage budgets and deal with staff merit and labor issues, and one for "functional managers," who tend to business and ensure that operations are carried out properly. Line managers with subordinates are assigned to the first path, and all other specialists are assigned to the second. With these two lines for advancement, we ensure that our diverse personnel have opportunities to develop as managers.
We also apply common global rules to our pay scale, including basic pay and bonuses. Previously, for example, bonus payments in each country mainly reflected the performance of Advantest's subsidiary or affiliate in that country, but under the new system, bonus payments reflect the Company's consolidated earnings. Starting in fiscal 2012, we have applied a new system of evaluating employee performance. No matter where Advantest employees work, they can now be evaluated and rewarded according to the new common global system, with every employee receiving an evaluation/cultivation interview at least once a year.
Since the introduction of our global human resources system, during which efforts have been made to increase the number of employees seconded from Japan to overseas postings and the number of personnel exchanges with overseas affiliates; this system has contributed to invigorating the organization and improving corporate performance.
Global job level and title
Meanwhile, the new human resources framework offers labor management flexibility in setting up working hours, telecommuting arrangements and other job specifics, so that managers can more aptly address such matters directly in accordance with the laws and regulations of their respective nations and in line with local employment practices.
Starting from fiscal 2014, we have established a global personnel database, which is effectively utilized for project team composition and smooth personnel changes on a global scale. Beginning in fiscal 2015, we began using a new global personnel evaluation system to replace the existing personnel evaluations. In the future, we will be setting up human resource development schemes with a worldwide reach, promoting employee diversity through active efforts to hire and promote employees with different backgrounds, and taking decisive steps toward forging an employee recruitment strategy that is in accordance with the business strategies of our operations in diverse countries.
In the spirit of establishing ourselves as a truly global company going forward, Advantest will continue to work hard to create a professional business environment where every member of a diverse Advantest Group workforce can make the most of his or her individual capabilities.
Reflection of the core values in the evaluation system
Since the launch of the INTEGRITY Core Values in 2019, we dedicated a section of the evaluation sheet in the personnel evaluation system to the core values, providing an opportunity to reflect on our actions during the term.
Specifically, the nine values of INTEGRITY (Innovation, Number One, Trust, Empowerment, Global, Respect, Inclusion & Diversity, Teamwork, and Yes) are used as the behavioral evaluation items on the evaluation sheet, where employees describe their own actions for each of the items on the sheet. Employees are encouraged to discuss with their supervisors during the evaluation interview, and their supervisors provide feedback with comments after the interview.
It is crucial for us to not only understand our core values in words through trainings or other means, but also act for it by linking these values to our own actions. Reflecting on them during the evaluation process will ultimately encourage changes in each employee, which help realize an organization that can flexibly address various issues.
Incentives and Retention
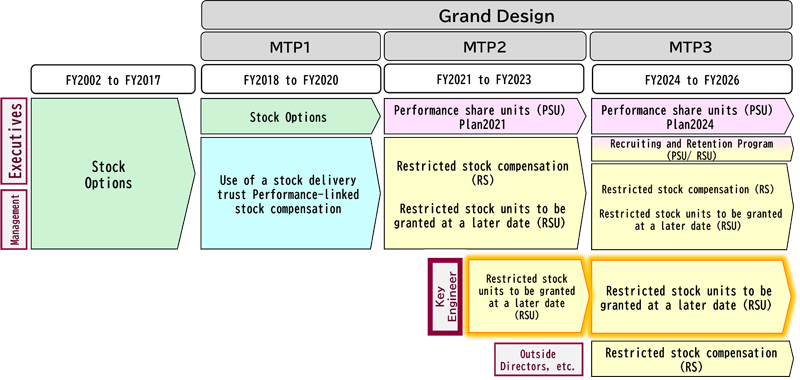
Since 2002, Advantest has introduced stock options as stock compensation for directors and executive officers, as well as domestic and international executives and employees. While ensuring the functionality of the stock compensation system as an incentive and/or as a retention measure, we established a framework that allows employees to own shares in the Company globally in conjunction with the formulation of the 2nd Mid-Term Management Plan for FY2021, having undergone several transitions.
Competition for talent is intensifying in many countries than ever before. In order to secure world-class engineers, we have expanded the scope of compensation grants and introduced RSUs for retention as stock compensation with a three-to-five-year transfer restriction period. We are continuing to review the scope and scale of our retention compensation.
In addition to appropriate guidelines for payroll and creating a comfortable and rewarding workplace in the spirit of our INTEGRITY core values, we believe that such incentive and/or retention measures will also help improve employee turnover.
Overview and Changes in Stock Compensation Plans
Pension system
Domestically, Advantest has introduced a point system to determine
retirement benefits. In addition, Advantest has introduced a fund-type
defined benefit corporate pension system as part of the retirement
benefit system, where the retirement benefit can be received as
pension under certain conditions.
In fiscal 2018, Advantest incorporated a defined contribution
corporate pension system as part of its defined benefit corporate
pension system and started the defined contribution corporate pension
system in addition to the point-based retirement benefit system.
As a result, retirement benefits will be divided into a retirement
lump sum paid by the Company, the benefit from the fund which can be
paid out as pension according to the years of service and the defined
contribution.
Employment Data
Advantest Group has formulated a basic policy to promise that it respects the human rights of individual employees, eliminate discrimination based on race, gender, age, nationality, religion, social status, disability, disease, sexual orientation, and so on. Advantest is also eliminating discrimination in employment and promotion and actively employing, developing, and promoting personnel who can play a leading role in global situations.
The graph below shows the trends in the number of employees.
Number of employees by region
-
*Boundary of data: Advantest Group
Number of managers by region
-
*Boundary of data: Advantest Group
-
*Definition of managers: Level 7 or higher in the 10-level qualification system. In this 10-level qualification system, Job Levels 1 to 6 are applied to general employees and Job Levels 7 to 10 to managers.
Number of employees by type
-
*Boundary of data: Advantest Group
Number of employees by age
-
*Boundary of data: Advantest Group (full-time employees only)
Number of new employees
-
*Boundary of data: Advantest Group (full-time employees only)
Employee turnover
-
*Boundary of data: Advantest Group (full-time employees only)